Battle Royale Simulation Using Heatmaps
(The simulations running below are GIF images, keybinds will not work)

Summary
This project explores how data-driven systems like Heatmaps can be used to simulate and influence game behavior in a Battle Royale environment. The goal was to design reactive systems that adapt in real time, showcasing both technical implementation and design thinking.
A Heatmap is usually implemented using a graph data structure of some kind, spanning the area of the game world you want to track activity in, where each graph node tracks activity at that point of the graph as "heat" on their part of the "map". In my implementation, each Heatmap consists of a 2D grid of cells (🔍)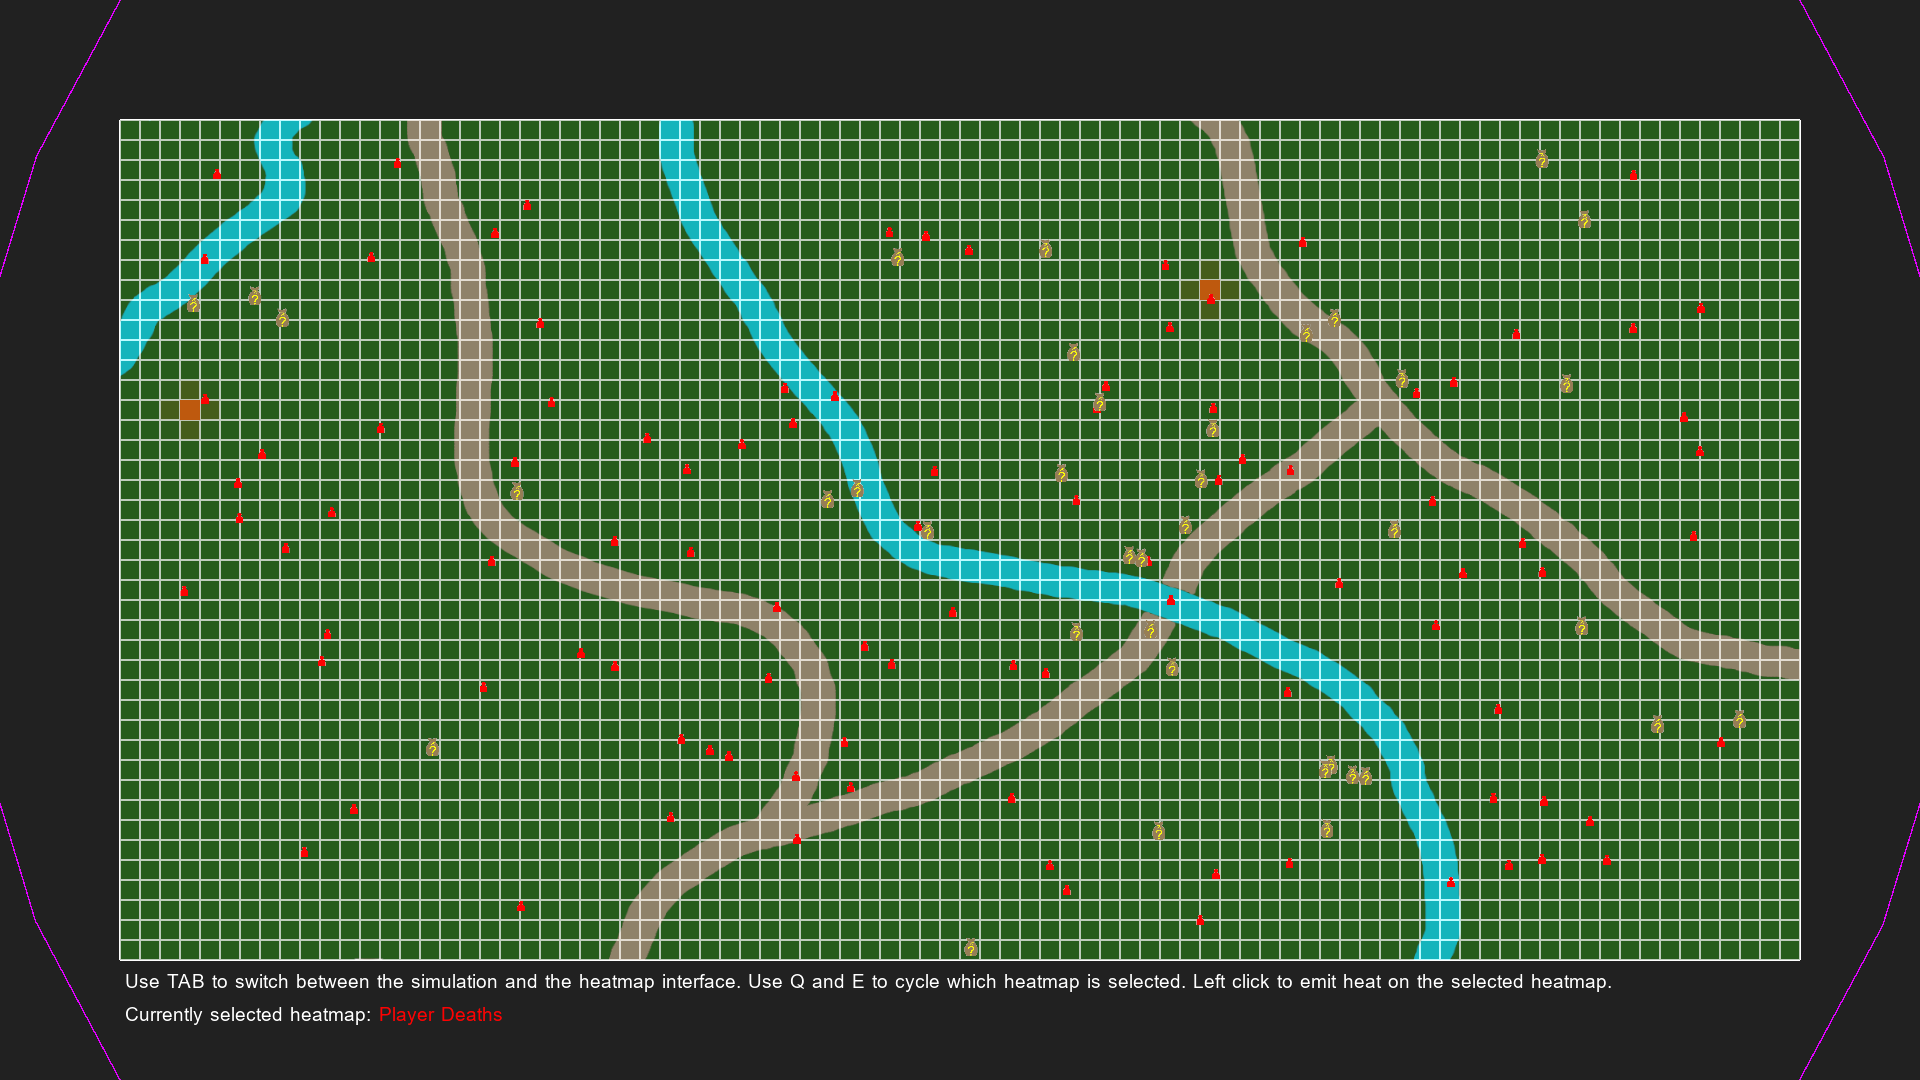 that track a floating-point heat value between 0 and 1. Cell size is adaptable for each Heatmap, allowing some types of data to be collected with more precision (e.g. player positions) and others over a larger area where precision is less important (e.g. strong weather).
I intentionally made the game rounds run much faster than in a typical Battle Royale game to allow for many more simulations while still producing results representative of a longer round. This not only provides a larger dataset to work with but also enables faster testing and iteration on individual simulation components. Additionally, I kept the game objects intentionally simple so that I could focus most of my time on developing the Heatmaps and algorithms. The air drops, loot piles, and AI pawns only needed to emit valuable data onto the Heatmaps so that the surrounding systems could function properly.
Though it would be fun to create AI that behaves like real players in a Battle Royale game (maybe I will in the future), that wasn't the goal of this project. Instead, this project serves as a showcase of how data can be continuously collected and utilized over the course of such a game, as well as how that process can be implemented effectively.
How the Simulator Works
Loot Piles
Loot piles are static and simple objects in my simulator. They mostly exist because all Battle Royale games have loot on the ground, and they help direct the pawns to do more than just try to kill each other and run to the center of the safe zone. Once picked up by a pawn they emit heat on the Looted Spots Heatmap.
AI Pawns
The behavior of AI pawns is central to how the simulator generates meaningful Heatmap data. While alive, pawns continuously emit heat onto the Time Spent In Area Heatmap. Furthermore, pawns are allowed to attempt a series of actions once per second. They kill any other pawns they can reach (emitting Player Deaths heat), pick up any loot they can reach (emitting Looted Spots heat if it was a loot pile), and evaluate whether to orient themselves either toward the nearest pawn or loot within detection range (but out of reach), or away from the edge of the safe zone to try to stay alive. I found that timing their behavioral sequence to once per second was a good sweet spot for emitting valuable data onto the heatmaps and not ending the game round too soon.
The Safe Zone
A continuously shrinking safe area is core to most battle royale games, and just like in my simulator, it's almost always defined as a circle shrinking in a certain direction in even intervals spread over the course of the game round. Any pawns caught outside the radius of the safe zone while it's shrinking are instantly killed (emitting Player Deaths heat). When it's time for a new shrinking interval to begin, the simulation samples cold spots from the Player Deaths, Time Spent In Area, Looted Spots and Weather Heatmaps. Using directional vectors from it's current center point toward the sampled cold spots, it then combines those directions after scaling them based on an array of how much each Heatmap "weighs" for the purposes of data sampling. Heavier weight meaning it takes more of that direction into account when determining its final shrinking direction.
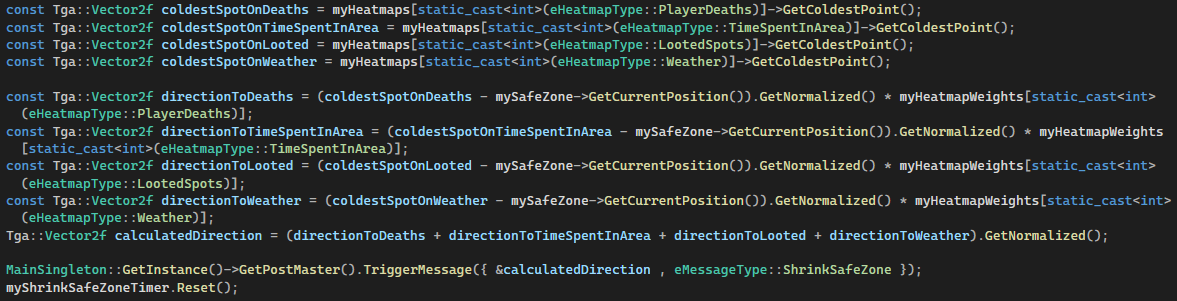 Go to the function on GitHub
Air drops are similar to loot piles. They too mostly exist to alter the behavior of the pawns and emit valuable heat data. New air drops spawn in the coldest cluster within the current safe zone. This usually means that the drop is positioned as far as possible from previous drops without being placed at the very edge of the safe zone. They spawn "in the air", first emitting heat on the Air Drops Heatmap, then drifting over time based on the direction of the wind sampled from the Weather Heatmap until they "land" and are able to be looted by pawns.
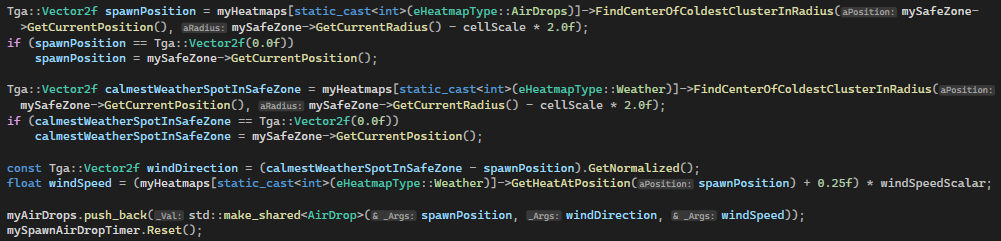 Go to the function on GitHub
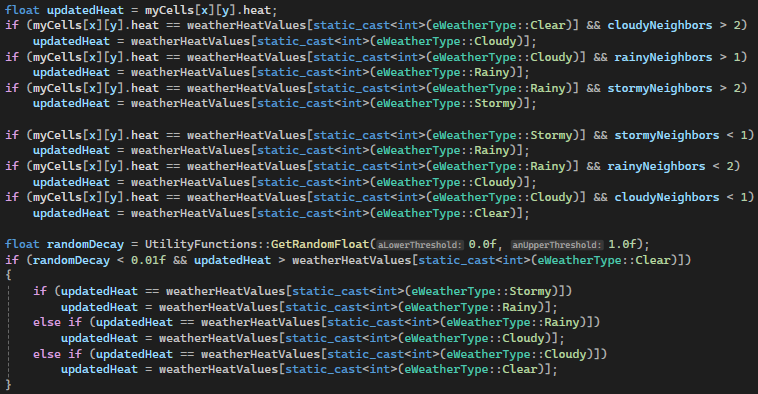
The weather system is another dynamic component to the simulator that impacts gameplay and Heatmap evolution. It's built on its own Heatmap, but it behaves quite differently from the others. Instead of having heat emitted and diffused based on game events, the weather map is procedurally generated using Cellular Automata (a mathematical model used to simulate patterns of replication and decay). Each cell in the Weather Heatmap can at any given time be in one of four possible weather states: Clear, Cloudy, Rainy, or Stormy. When the map updates, each cell checks the states of its neighboring cells and, based on rules defined in my algorithm, decides whether to calm down, stay the same, or escalate to a more intense weather state.
To prevent the entire map from settling into a uniform state (such as all cells being Clear or all Stormy), I biased the algorithm slightly toward escalation. At the same time, I added a small random chance for decay to ensure the system stays dynamic and never truly stabilizes. If you're familiar with Conway's Game of Life, that's also a simulation based on Cellular Automata.
 Go to the snippet on GitHub
The Heat Sampling Algorithms
Breadth-First Search (BFS)
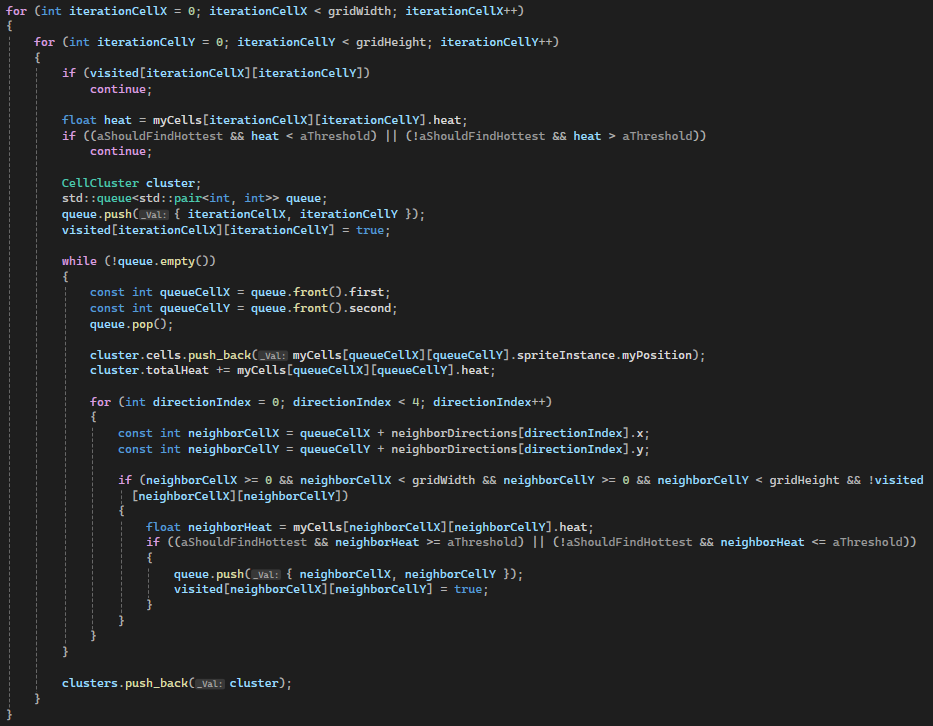
To identify clusters of hot or cold cells, my algorithms use Breadth-First Search to group together neighboring cells that meet specific heat thresholds, at or below a defined value for cold clusters, and at or above it for hot clusters. A set of visited cells is maintained throughout the search to avoid evaluating the same cell more than once. This sampling method relies on meaningful heat distribution across the Heatmaps. If the grid is overwhelmingly hot or cold, the entire map could end up being treated as a single massive cluster, reducing the usefulness of the data. To address this issue, I also implemented a technique of cluster splitting, which I cover in more detail later in this section.
 Go to the snippet on GitHub
Limiting the Sample to a Radius
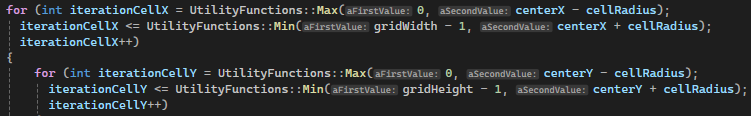
For algorithms requiring samples from within a certain area, I developed a more specialized version of my first sampling algorithm. In this new version I use a position and a radius as input parameters, calculating indices to visit during my Breadth-First Search using the radius and eliminating edge cells using radius squared distance checks.
 Go to the snippet on GitHub
Cluster Splitting
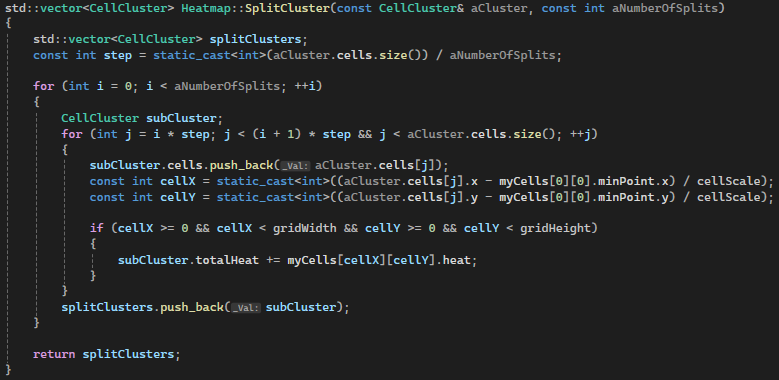
Early on in development, I ran into a frustrating issue where narrow channels of cold would snake around hot spots, causing almost the entire grid to be treated as a single cluster. To solve this, I implemented a system for splitting large clusters into smaller, more manageable segments. By defining cluster size limits based on the scale of each sampling algorithm, allowing larger clusters when sampling broader areas, and smaller ones for more localized sampling, I was able to extract more meaningful data and create a simulation that not only performed better but also looked better.
 Go to the function on GitHub
My Thoughts When Determining the Rules of the Simulation
Avoiding Predictability
A common problem in competitive games is predictability. Players like to learn the rules of the game to try to figure out e.g. better areas to go to or where the safe zone is going to move ahead of time. I wanted to try to develop a kind of solution to that problem using game events that actively adapt to the state of the game round and each player's actions. That way, even skilled players with great pattern recognition can't predict what's going to happen next, keeping every round fresh and uncertain.
Leveling the Playing Field
Staying in the same spot for too long can give players an edge in both survival and combat. To mitigate this, the safe zone actively avoids areas where pawns have lingered, encouraging movement and reducing the effectiveness of camping strategies. Likewise, it avoids regions where a lot of loot has been picked up, preventing already well-equipped pawns from gaining even more of a positional advantage. The same approach is applied to air drop spawns, with new drops steering clear of previous drop zones to discourage repeat looting and keep the competition balanced.
Producing Varied Results
To encourage more variation between simulation rounds and to generate more diverse results, objects in each new round avoid spawning in the same locations as the previous one. New loot piles spawn away from areas where loot was picked up (🔍) , and AI pawns spawn in different locations than last round (🔍)
 .
.
Preventing Clustering
Because I wanted to avoid funneling pawns into already active hotspots, and to encourage a more even spread of engagement across the map, I decided to make the safe zone avoid areas with high death counts to help reduce early-round clustering.
Applicable Use Cases and Further Possibilities
Tools for Designers
If a system like this were integrated into a real game environment, with Heatmap and sampling algorithm parameters exposed through an editor or runtime developer tools, it could offer a wide range of possibilities for UI, level, and game designers. It would give them fine-grained control over how events in the game world evolve, and provide powerful new tools for balancing and adding depth to gameplay.
Map Events
A system like this could be seamlessly integrated into the UI of many different game genres. Even within the Battle Royale genre alone, the potential applications are numerous. For example, the Time Spent In Area Heatmap could be used to display indicators that hint at player presence in a given area. Similarly, the Weather Heatmap could drive visualizations like air current flow on the map using sprites or visual effects.
Better Weather System
There's a lot of potential in further developing the weather system. I originally added it because it fit the theme of the simulation and gave me a chance to revisit procedural generation. There's still plenty of room to refine it, such as implementing realistic air current propagation across the map, rather than simply treating the coldest point as the direction winds are blowing toward. Overall, I'd like the system to behave more like real weather, rather than the chaotic back-and-forth between stormy and clear conditions that currently plays out during the simulation.
Advanced AI
With more time invested in the project, the AI could be significantly improved to feel much more intelligent and dynamic. They could use Finite State Machines or Behavior Trees to improve decision-making, and incorporate Steering Behaviors influenced by data from various Heatmaps. Their choices could adapt in real time by adjusting decision weights based on sampled data. They could also be given visibility ranges, affected by factors like weather, to create more realistic perception and behavior.
Voronoi Diagrams
I had originally planned to add procedurally generated Points of Interest using Voronoi Diagrams (a method for partitioning a space into cells based on distance to a set of seed points), but ended up cutting that feature to keep the project within a manageable scope and timeline. Even if I had implemented it, for the Points of Interest to have meaningful impact, I would have had to introduce simulated geometry and collision detection into the game world, along with more work on the AI, and I just decided that adding all that would have pushed the scope far beyond what was realistic for the time that I had.
The Heatmaps Progressing over the Course of a Round
Player Deaths
Time Spent In Area
Looted Spots
Air Drops
Weather